
File:PV cume semi log chart 2014 estimate.svg

Size of this PNG preview of this SVG file: 698 × 521 pixels. Other resolutions: 320 × 239 pixels | 640 × 478 pixels | 1,024 × 764 pixels | 1,280 × 955 pixels | 2,560 × 1,911 pixels.
Original file (SVG file, nominally 698 × 521 pixels, file size: 117 KB)
| This is a file from the Wikimedia Commons. Information from its description page there is shown below. Commons is a freely licensed media file repository. You can help. |
Summary
| Description |
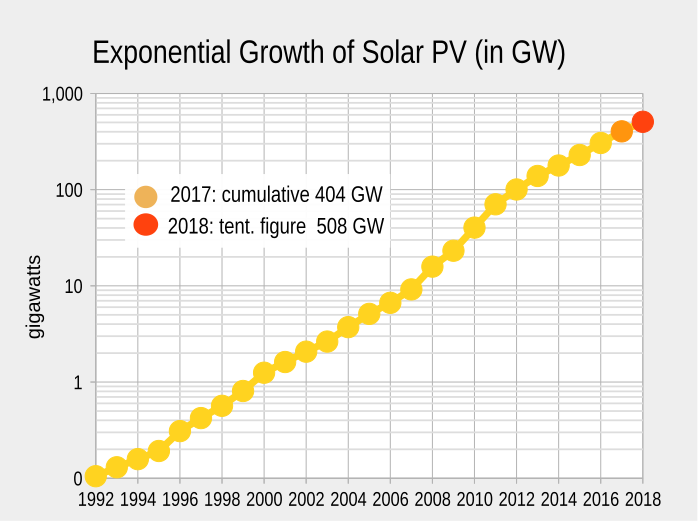
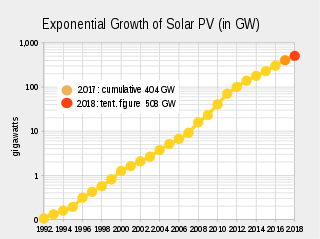
English: Exponential growth-curve on a semi-log scale of worldwide installed photovoltaics in gigawatts since 1992. (Figures for cumulative nameplate capacity in wattDC, watt-peak). |
| Date |
(first version) This W3C-unspecified vector image was created with Inkscape . |
| Source |
Data sources in chronological order (year-end figures):
|
| Author | Own work, Rfassbind |
| Other versions | w:File:Cumulative Photovoltaic Installations.png, older version, by user BRW |
Licensing
| I, the copyright holder of this work, release this work into the public domain. This applies worldwide. In some countries this may not be legally possible; if so: I grant anyone the right to use this work for any purpose, without any conditions, unless such conditions are required by law. |
File history
Click on a date/time to view the file as it appeared at that time.
| Date/Time | Thumbnail | Dimensions | User | Comment | |
|---|---|---|---|---|---|
| current | 11:41, 14 February 2019 | | 698 × 521 (117 KB) | Rfassbind | update figures 2017/18 (sources in file description) |
| 18:42, 14 November 2017 |  | 698 × 521 (109 KB) | Rfassbind | update figures 2016/17 (sources in file description) | |
| 22:27, 8 March 2017 |  | 698 × 521 (110 KB) | Rfassbind | update with 2016 (est.) and 2017 (proj.), first draw | |
| 16:25, 19 June 2015 |  | 627 × 365 (68 KB) | Rfassbind | updated projected cume by the end of 2015 | |
| 13:20, 12 June 2015 |  | 627 × 365 (68 KB) | Rfassbind | finalized 2014-figures based on EPIA (SPE) Global Market Outlook for PV 2015-2019 | |
| 10:16, 3 April 2015 |  | 627 × 365 (69 KB) | Rfassbind | style fixes, legend for 2014e and 2015p | |
| 07:30, 3 April 2015 |  | 627 × 365 (61 KB) | Rfassbind | w/ 2014e and 2015p Dataset BP, EPIA from 2001 onward | |
| 22:41, 31 March 2015 |  | 627 × 380 (56 KB) | Rfassbind | revised 2015 projection from 240k to 230k due to lower confirmed figures for 2014 (~40 GW instead of 45 GW)) and a more conservative estimate of 50 GW for 2015. | |
| 20:56, 19 March 2015 |  | 627 × 380 (63 KB) | Rfassbind | added tentative 2015-estimate/projection (55GW, cume 240GW) | |
| 15:20, 8 November 2014 |  | 627 × 380 (61 KB) | Rfassbind | chngd layout |
File usage
The following pages on the English Wikipedia use this file (pages on other projects are not listed):
Global file usage
The following other wikis use this file:
- Usage on ar.wikipedia.org
- Usage on de.wikipedia.org
- Usage on eu.wikipedia.org
- Usage on fa.wikipedia.org
- Usage on fr.wikipedia.org
- Usage on sw.wikipedia.org
- Usage on zh.wikipedia.org